Agent Replay Debugging: How Cut-Point Replay Pinpoints Production Failures Faster Than Reading Logs
Agent replay debugging with cut-point replay lets you re-run failing LLM traces from any checkpoint—faster than parsing logs or full reruns.

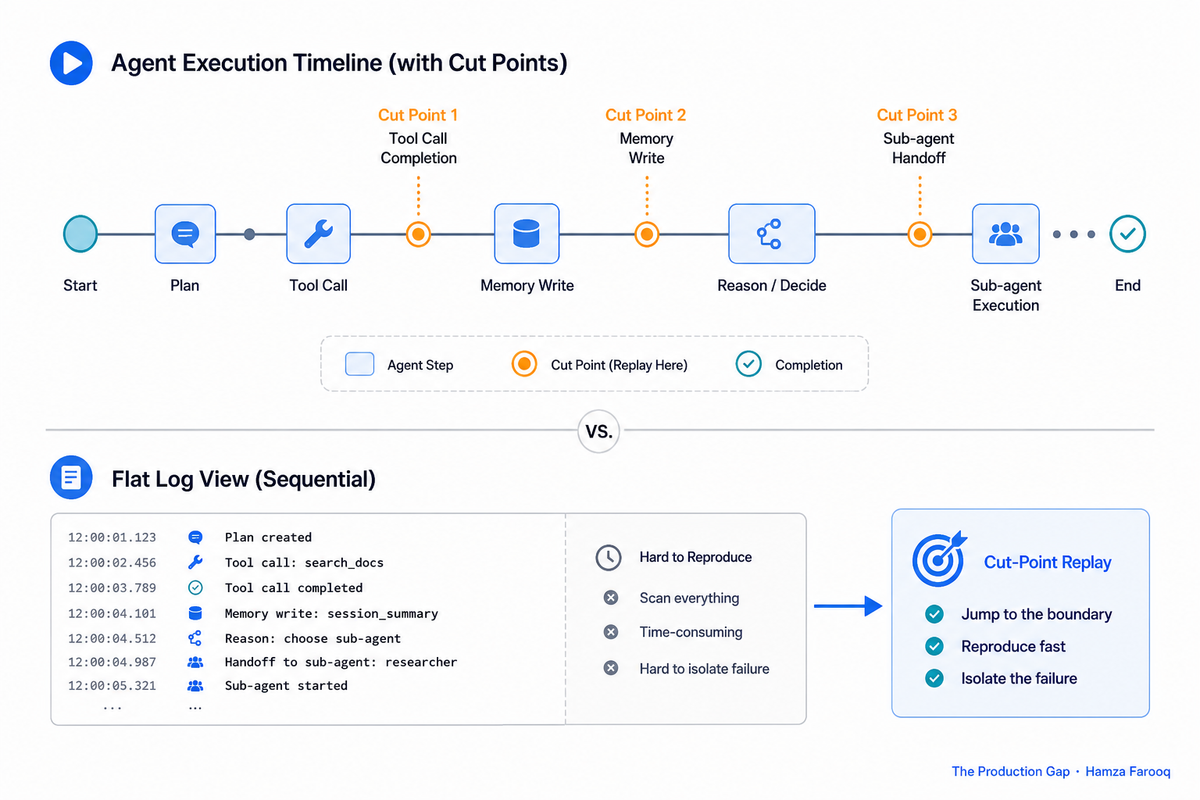
TL;DR: Agent replay debugging with cut-point replay lets engineers re-execute a failing agent from any semantic checkpoint, a tool call, LLM response, or state transition, without rerunning the entire trace from scratch. Tools like LangGraph.js, Burr, and the agent-replay CLI support this natively, as of June 2026, making it faster to isolate the exact step that caused a production failure than parsing through raw logs.
Key Takeaways
- Logs alone won't cut it: traces record sequence; they cannot let you rerun a moment to prove why it went wrong.
- Cut points are the core mechanic: freeze agent state at a meaningful boundary and restart execution from exactly that spot.
- State serialization makes replay possible: capture everything the agent knew, memory, context, and outputs already produced.
- Cached vs. live tool outputs is a real choice: cached replay isolates reasoning bugs; live replay checks whether the real world is the problem.
- Forking beats full reruns: branch from a cut point and compare outcomes side by side without restarting from step one.
- The tooling ecosystem already exists: LangGraph, Burr, and open-source tools give teams a practical starting point today.
Introduction
A cut-point replay reproduces a failure from a serialized snapshot without rerunning every prior step. A full rerun pays every token cost from step one, triggers live tool side effects, and restarts a process that may have taken significant time to reach the failure point. That cost gap is the core argument for replay, and as of June 2026 it is also the reason replayable agent runs are treated as a shipping-enabling debugging technique, not just a post-mortem tool.
Why can't you root-cause a production agent failure by reading the trace?
You cannot root-cause a production agent failure by reading the trace alone because traces record sequence passively while replay actively re-experiments at the exact failure boundary, and those are fundamentally different operations with different diagnostic power.
Observability is passive capture. Replay is active re-experimentation. The bug category traces structurally cannot expose is contextual non-determinism, where the same semantic boundary produces a different outcome because a tool contract changed, an external API returned subtly different data, or a cached result masked a live inconsistency. That shifts root-cause responsibility from the model to the tool integration layer. The model didn't hallucinate; the tool handed it bad data.
Zylos Research formalizing replay as a named discipline reflects a real structural gap: logs answer what happened, not whether the same conditions would produce the same result. Those are different questions requiring different tools.
How do you set a cut point and serialize agent state so replay is actually possible?
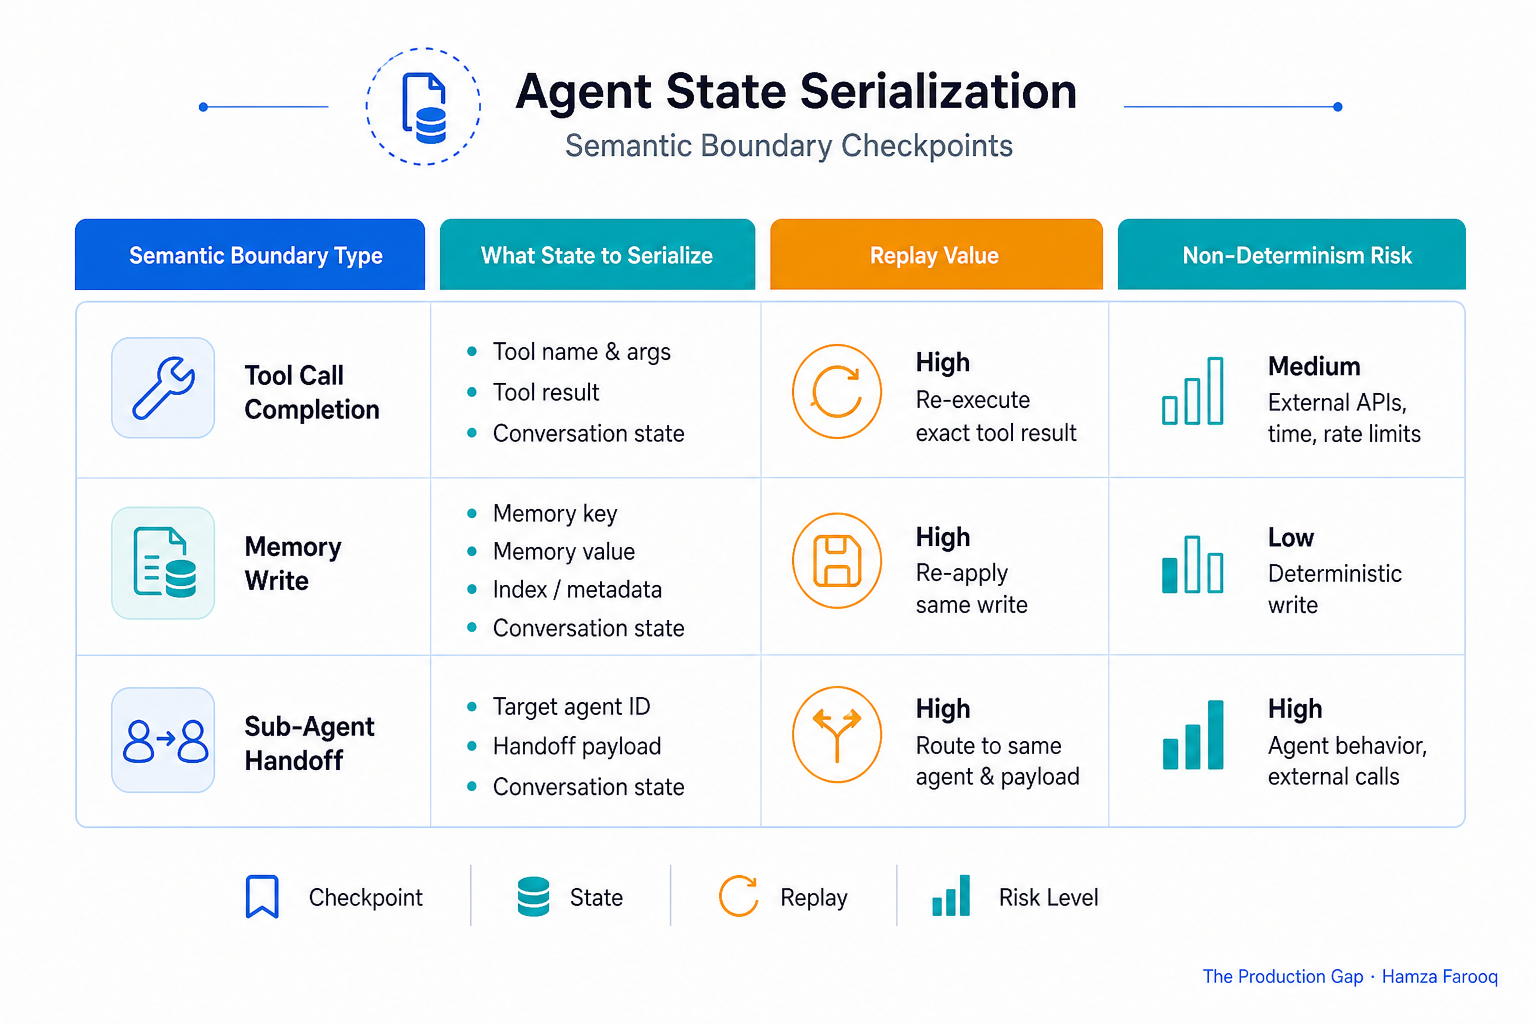
Which boundaries make valid cut points?
Tool call completion is the highest-value cut point. The tool has returned and its result is in context. This is where contextual non-determinism most often enters the system.
Memory write isolates whether downstream failures come from bad memory content versus bad reasoning over correct content. Different bugs, different owners.
What exactly must be serialized at each boundary?
Capture: full message history and context window, memory store snapshot, all tool outputs already produced (flagged cached or live), environment variables or session tokens, and execution graph position.
LangGraph.js implements this directly: its checkpoint stores the state dict, graph node pointer, and thread ID, giving you native rewind from any node boundary. If you cannot snapshot full boundary state, you have a bookmark, not a cut point. That distinction determines whether replay is actually reproducible.
How do cached vs. live tool replay and execution forking actually find the bug?
Cached replay freezes the tool output exactly as it was. If the failure reproduces, the bug is in agent logic or prompting. This is the right place to start, as a practical rule of thumb, since it avoids triggering live side effects and limits additional API spend. Live replay allows a real tool call. If the failure disappears with fresh data but reproduces with cached data, the original tool output was the problem. If it reproduces with fresh data too, the bug is in the integration contract itself, whether that is a schema mismatch, auth token expiry, or rate-limit-induced truncation.
That comparison is the operational proof of contextual non-determinism, the exact bug category traces cannot surface. Once you have identified the cut point, fork execution: branch A runs with original inputs; branch B runs with your hypothesized fix, letting you compare outcomes without rerunning from scratch.
ai-time-travel-debugger implements record, inspect, rewind, fork, and cached replay. agent-replay stores traces in SQLite locally for behavioral diffs without external dependencies. Burr's counterfactual replay architecture builds this as a workflow primitive, not something patched on top.
Which tools give you cut-point replay today, and how do you choose?
Table 1: Cut-Point Replay Tool Comparison, as of June 2026
| Tool | Architecture fit | Cut-point mechanism | Cached replay | Fork support | OTel integration | Local/hosted |
|---|---|---|---|---|---|---|
| LangGraph.js | Graph-based agents | Checkpoint per node | Yes | Yes (thread branching) | Partial (LangSmith) | Hosted optional |
| Burr | State-machine agents | Counterfactual replay architecture | Yes | Yes | Partial | Local |
| agent-replay (clay-good) | Any agent (CLI) | SQLite trace replay + diff | Yes | Yes (fork runs) | No native | 100% local |
| agent-timetravel (akshay-mp) | OTel-instrumented agents | OTel-in / replay-out engine | Yes | Yes | Yes (native) | Local |
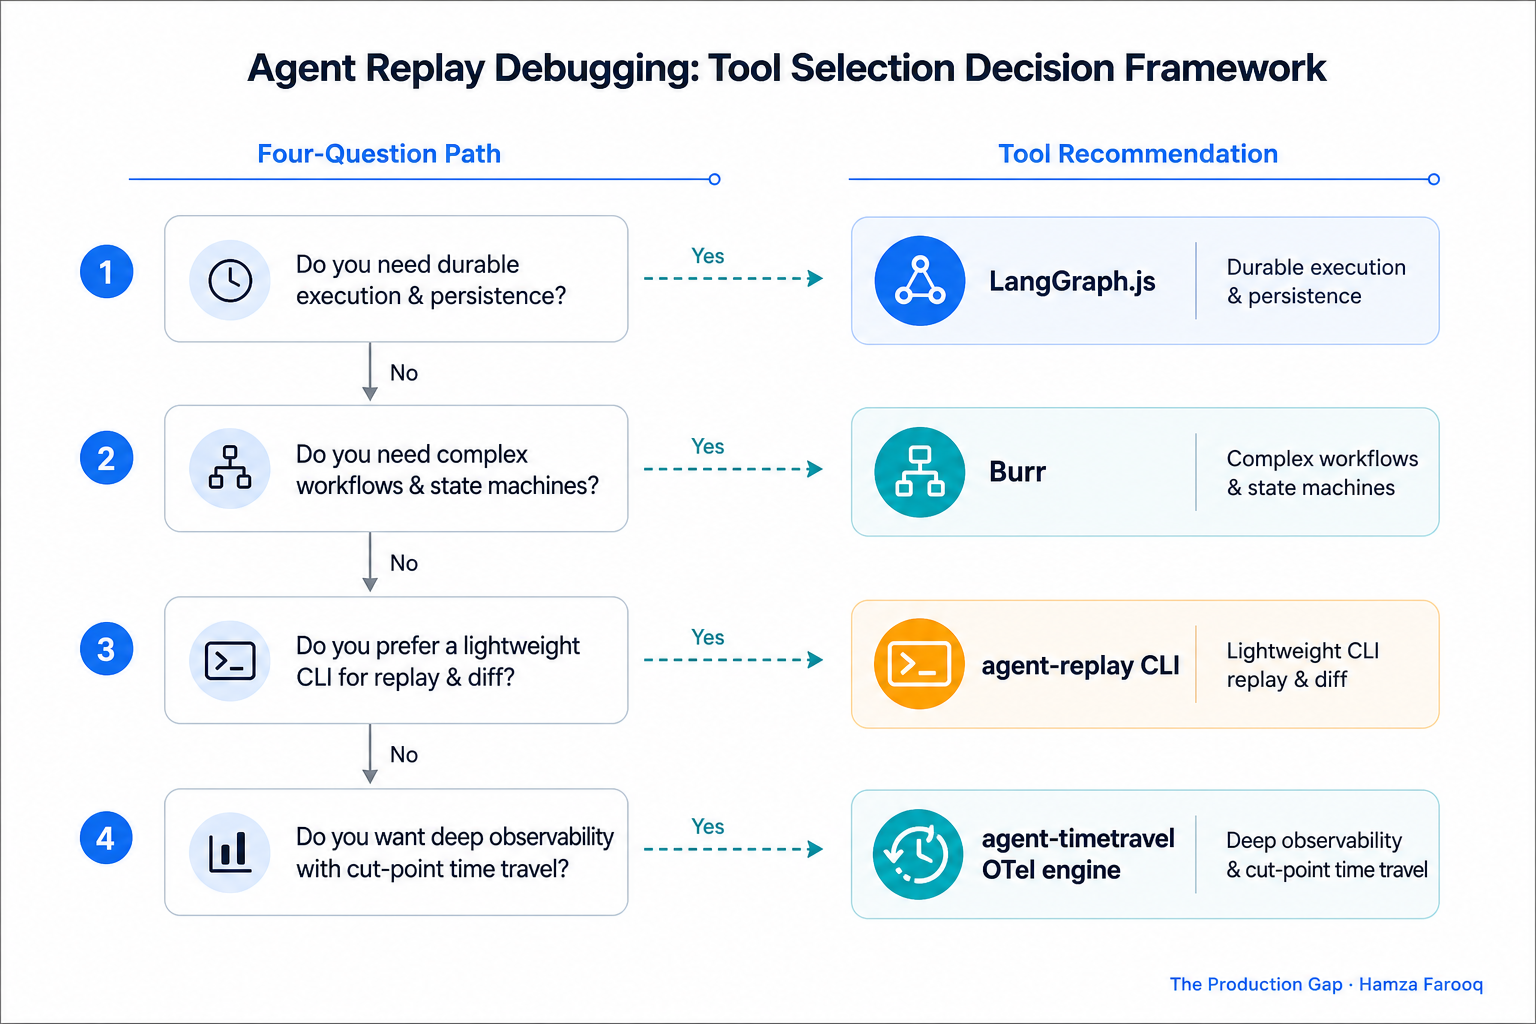
Which four questions narrow the tool choice?
Boundary: Boundaries already defined as graph nodes or state-machine transitions? Start with LangGraph.js or Burr. They map directly to native checkpoint primitives.
OTel: Already emitting OTel spans? agent-timetravel pipes from existing telemetry as an OTel-in/replay-out engine with essentially no adoption friction.
Local: Need zero data egress? agent-replay is 100% local SQLite, nothing leaves the machine.
Team: Building a custom pipeline? A practitioner documented building a time-travel debugger at the individual engineer level, no platform team required.
Frequently Asked Questions
What is the difference between agent replay debugging and just reading a trace log? Replay lets you reproduce a specific moment and test whether the same inputs produce the same output, whereas a trace only records what happened passively. This distinction matters because traces cannot expose contextual non-determinism, the class of failure where identical inputs at a given boundary produce different outcomes due to tool contract changes or live data drift.
How do you pick where to set a cut point in a multi-step agent? Set cut points at semantic boundaries where state is complete: tool call completion, memory writes, and sub-agent handoffs. When unsure, start at the last tool call before the failure, since that boundary is where contextual non-determinism most often enters the system.
When should you replay with cached tool outputs versus live tool calls? Start with cached outputs to isolate reasoning bugs without triggering side effects. If cached replay does not reproduce the failure, switch to live calls. The comparison between the two runs identifies whether the bug lives in agent reasoning or in the tool integration layer.
Does cut-point replay work without a graph-based framework like LangGraph? Yes. Tools like agent-replay and agent-timetravel work with any OTel-instrumented agent. The requirement is state serialization at the semantic boundary, not a specific orchestration architecture.
Conclusion
The sharpest use of agent replay debugging, in the framework used in this guide, is as a proof mechanism. Cached vs. live tool replay at the same cut point is the only operation that actually demonstrates whether a failure lives in model reasoning or tool integration. That distinction changes who fixes the bug, prompt engineers or platform engineers, and those are different people with different fixes.
Semantic boundaries belong in your agent architecture from the start, for the same reason you define unit test boundaries before a codebase gets large: retrofitting them after a failure is possible but harder. They are design decisions that make the system debuggable by intent, not by luck.
Learn from me
Forward Deployed Engineering Bootcamp for Full-Stack Developers, my Maven cohort. Build and ship complete AI products end to end, from React and Node.js frontends to deployed models with caching and observability. Join the next cohort →
Hire us
Traversaal.ai. We're a team of forward deployed engineers solving the toughest AI problems for Fortune 100 companies: document intelligence, agentic data platforms, and real-time web intelligence, deployed in production. Work with our team to deploy your next agentic ecosystem. Talk to Traversaal.ai →
Join us
Want to solve these problems with us? We're always looking for forward deployed engineers who want to ship production AI. jobs@traversaal.ai